Overpriced Resilience, Underpriced Fragility: Analysis of a Narrow, Inflation-Constrained, Liquidity-Sensitive Market
“Give a portion to seven, and also to eight; for you do not know what misfortune may occur upon the earth”
— King Solomon, Kohelet (Ecclesiastes) 11:2
Evaluating the Probability of a Severe Market Drawdown Amidst Sovereign and Consumer Credit Fragility
The global macroeconomic and financial landscape in May 2026 is defined by a profound dichotomy. Cap-weighted equity indices sit at record highs, driven by a highly concentrated technology sector and massive capital deployment in artificial intelligence. Simultaneously, the underlying macroeconomic indicators exhibit structural deterioration. High energy costs stemming from the war in Iran, resurgent inflation, historic lows in consumer sentiment, rising consumer defaults, and severe sovereign fiscal constraints have created a fragile, K-shaped economic environment.
This report provides a rigorous cross-asset analysis evaluating the validity of a bearish thesis we have been debating internally and hearing from many investors throughout the various corners of the sentiment landscape; that a systemic crisis and subsequent equity market drawdown on the order of 35% - 45% is imminent. By examining consumer credit fragility, monetary policy constraints, corporate concentration, geopolitical supply bottlenecks, and near-term market catalysts, this analysis provides institutional investors with context with which to think about it, as well as a framework for how to approach it vis-a-vis risk management and capital allocation.
Macroeconomic Foundations and Consumer Credit Fragility: The Acceleration of Consumer Default Cycles
The American consumer remains the central variable in any serious assessment of systemic downside risk, because personal consumption expenditures account for roughly 70% of U.S. GDP. Beneath the surface of still-resilient aggregate spending, however, the data are beginning to show a more troubling progression: consumer stress is migrating from sentiment into payment behavior. Three separate, but closely related, measures of U.S. household financial distress are now at or above levels last associated with the aftermath of the 2008 financial crisis.
While overall household leverage remains low by historical standards, consumer default rates in specific debt categories have surpassed Great Financial Crisis levels, indicating severe financial distress among the lower tranches of the K-shaped economy.
The percentage of credit card balances at least 90 days delinquent rose to 13.12% in the first quarter of 2026, representing a 15-year high and the highest level recorded since the aftermath of the 2008 crisis. Total credit card debt has ballooned to a record first-quarter high of $1.25 trillion, up from $1.18 trillion in the previous year. This default cycle is directly tied to the surge in credit card interest rates, which averaged 21% in February 2026 compared to 14.6% in February 2022, compounding the debt burden of households using credit cards for basic survival expenses.
Similarly, subprime auto loan delinquencies have spiked to elevated historical levels, driven by the dual pressures of vehicle price inflation and high borrowing costs. Student loan delinquencies are also showing signs of upward momentum as pandemic-era forbearance structures have fully expired, leaving a highly debt-laden middle-income cohort with diminished discretionary cash flow. Indeed, it seems the concerns around indicators and themes discussed in our report titled “The Architecture of Fragility” are continuing to devolve.
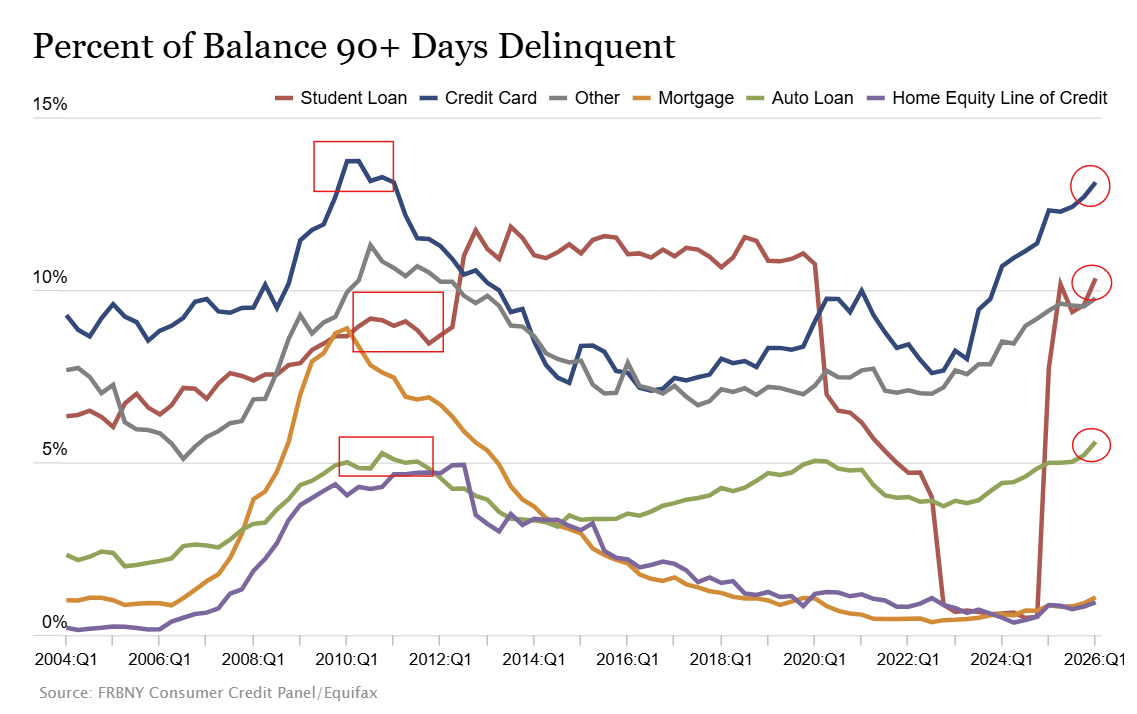
Ninety-day delinquencies on credit card balances are approaching post-GFC highs. Ninety-day delinquencies on student loans already stand above levels seen during the financial crisis itself and are rising toward the 2013–2014 peak. Auto-loan delinquencies have now surpassed post-GFC levels. Mortgage and HELOC delinquencies remain comparatively low, but even there, the direction of travel has turned upward. Viewed in real-world terms, the pattern is both alarming and intuitive. A household strained by higher prices across the necessities of daily life, and then further pressured by materially higher credit costs, will usually default first on revolving credit. As financial distress deepens, the next pressure point is student debt, followed by the vehicle loan. The last obligation the household will defend is the one attached to shelter. That hierarchy matters: the consumer is not yet collapsing, but the sequence of distress is already visible.
The Consumer Sentiment and Confidence Divergence
Perhaps unsurprisingly given the aforementioned, in May 2026, the University of Michigan Index of Consumer Sentiment plummeted by 5.0 points to 44.8, marking the lowest level in records dating back to 1978.
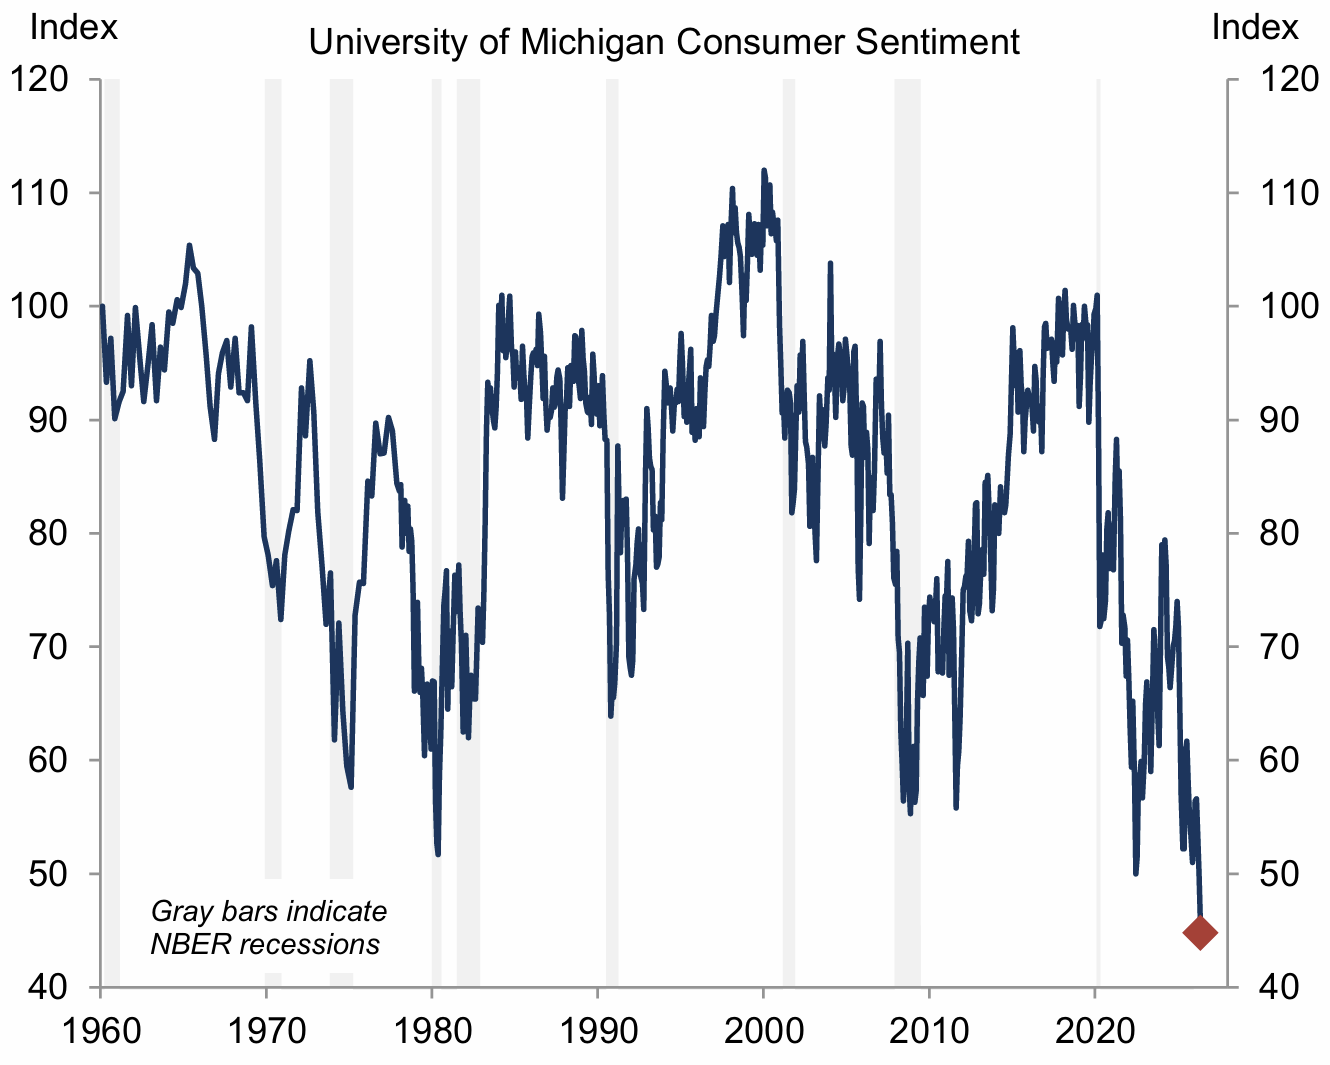
Goldman Sachs - U. Michigan Consumer Sentiment May 2026
This historic low eclipses the troughs recorded during the 2008–2009 Great Financial Recession, the COVID-19 pandemic, and the stagflationary recessions of 1980–1982. The primary driver of this collapse is the erosion of personal finances by high prices, with 57% of consumers spontaneously citing the cost of living as a primary concern. This sentiment is highly sensitive to gasoline and energy prices, which have spiked due to the ongoing war in Iran and a 90% drop in transits through the Strait of Hormuz.
Conversely, the Conference Board Consumer Confidence Index turned in a reading of 93.1 in May, down slightly from 93.8 in April. This divergence is explained by the different compositions of the indices: the Conference Board measure is heavily weighted toward labor market appraisals which remain relatively stable with unemployment at 4.3%, while the University of Michigan index is highly sensitive to real purchasing power, energy prices, and political sentiment.
The Mechanics of the K-Shaped Consumer Economy
The underlying driver of this consumer distress is the severe deceleration in real income growth. In March 2026, real disposable personal income growth slowed to just 0.4% on a year-over-year basis and 0.2% on a six-month annualized basis. While a temporary $140 billion boost from tax cuts under the Outlaying Broad-Based Budget Agreement (OBBBA) provided short-term support during the spring tax-filing season, this fiscal cushion is rapidly fading.
For the bottom income quintile, real income growth is projected to grow by just 0.5% in 2026, compared to 1.3% for the overall population. Because lower-income households spend a disproportionate share of their budgets on energy, food, and housing, the resurgent inflation driven by Middle Eastern supply disruptions represents an immediate tax on their consumption power. As the WSJ also recently reported, this forces a transition to "survival debt," where credit utilization rises to smooth energy and food price shocks, eventually leading to default as borrowing limits are reached. It bears repeating that the U.S. consumer described in these data - the very source of sustained economic growth - accounts for 70% of GPD. If the proverbial music is coming to a stop for the engine of the U.S. economy, how much longer can markets sustain this apparent disconnect from fundamental support?
The Monetary Policy Dilemma and U.S. Sovereign Fiscal Constraints
The Federal Reserve is currently caught in a complex policy trilemma, balancing a resurgent inflation shock, slowing economic growth, and the structural limits imposed by the massive U.S. sovereign debt burden.
Rising Inflationary Pressures and Trimmed-Mean Metrics
Inflation has shown significant upward momentum in recent prints. In April 2026, the Consumer Price Index (CPI) rose by 0.64% month-over-month (+3.81% year-over-year), while Core CPI increased by 0.38% month-over-month (+2.75% year-over-year), exceeding consensus expectations. Concurrently, the Producer Price Index (PPI) surged by 1.4% month-over-month (+6.0% year-over-year), driven by a 7.8% spike in energy costs and a 5.0% increase in transportation and warehousing services.
This resurgent inflation is not merely a transient fuel shock. The Dallas Fed's Trimmed-Mean PCE, which filters out extreme price moves to isolate the underlying trend, rose by an estimated 0.25% in April, representing an annualized rate of 3.0%, well above the Federal Reserve’s 2% target. Furthermore, the University of Michigan survey indicated that year-ahead inflation expectations have climbed to 4.8%, while long-run inflation expectations have risen to 3.9%, suggesting that inflation is becoming structurally embedded in consumer behavior.
The Sovereign Debt Constraint and Fiscal Dominance
With the U.S. national debt at its highest level in history, the federal government faces a compounding interest expense problem. The yields on the 10-year U.S. Treasury note have consolidated above 4.5%, while the 30-year Treasury yield has crossed over 5.0%. This spike in term yields has dramatic implications for the federal budget.
As low-yielding Treasury debt issued during the pandemic matures, it must be refinanced at current market rates. This refinancing wave threatens to push net interest payments to a level that consumes an unprecedented share of federal tax revenues, effectively creating a regime of "fiscal dominance." In this environment, the Federal Reserve's monetary independence is structurally compromised.
If Chairman Kevin Warsh, who was sworn in on May 22, 2026, and the Federal Open Market Committee (FOMC) raise the Fed Funds rate to combat the resurgent inflation expectations, the interest payments on the national debt will rise rapidly, exacerbating the federal deficit and restricting the government's fiscal capacity. Conversely, if the Fed cuts rates to alleviate the sovereign debt service burden or to support a slowing labor market, they risk stimulating into a supply-driven inflation shock, further de-anchoring long-term inflation expectations and eroding the purchasing power of the U.S. dollar.
Given that the federal budget deficit is projected to hit $1.95 trillion in fiscal year 2026, the compounding effect of refinancing outstanding maturities at rates above 4.5% severely constrains the monetary options available to the central bank.
The Halting of the Easing Cycle
Faced with these structural constraints, global central bank easing cycles have come to a sudden halt. In developed markets, 0% of central banks lowered policy rates over the three months leading into May 2026, while financial conditions tightened by 35 basis points globally, reflecting the hawkish shift in bond markets.
The Federal Reserve has been forced to adjust its trajectory. In response to heightened inflation concerns, the Fed pushed back its projected rate cuts to December 2026 and March 2027. Futures markets have gone even further, completely pricing in a quarter-point rate increase by the end of 2026, a dramatic shift from the start of the year when investors anticipated multiple rate cuts.
Equity Market Concentration and Valuation Overhang
In stark contrast to the credit distress of households and the fiscal constraints of the sovereign, equity markets have entered a highly concentrated, momentum-driven phase.
The "One Big Trade" and Narrowing Breadth
The U.S. equity market has exhibited extreme concentration, prompting portfolio managers to describe the market as "one big trade" centered entirely on artificial intelligence and technology hardware. The S&P 500 returned 10% year-to-date through mid-May 2026, registering 14 new record highs. However, the Information Technology and Communication Services sectors (plus Amazon and Tesla) accounted for an astonishing 85% of this return. The S&P 500 excluding these technology-related exposures returned just 3% year-to-date. Nvidia alone, which accounts for 9% of the S&P 500 by market capitalization, contributed 20% of the aggregate index return.
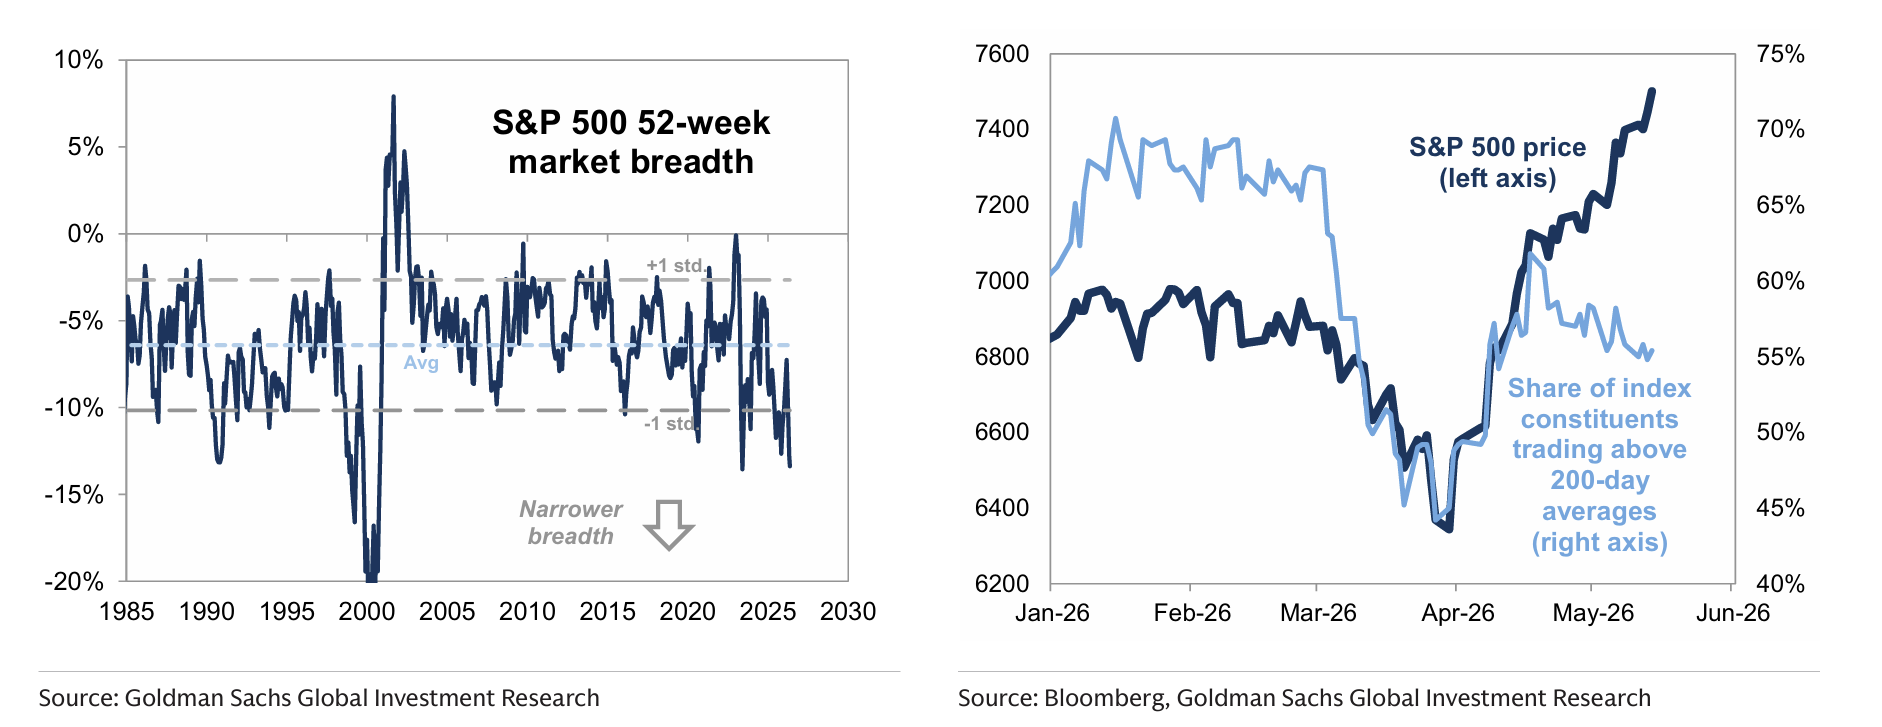
This massive concentration has resulted in exceptionally narrow market breadth. While the cap-weighted index registers record highs, the share of index constituents trading above their 200-day moving averages has steadily declined. The median S&P 500 stock trades 13% below its 52-week high, and over 40% of the S&P 500 is trading at or near 52-week lows, indicating a stealth bear market beneath the surface.
Historically, such severe declines in breadth near equity market highs have signaled a significant increase in index volatility and preceded soft returns over the subsequent 3 to 12 months, as observed in mid-1998, late 1999, mid-2015, and late 2021.
Valuation Extremes: Shiller CAPE and the Buffett Indicator
By almost any long-term fundamental metric, aggregate equity valuations are severely stretched:
Shiller CAPE Ratio:
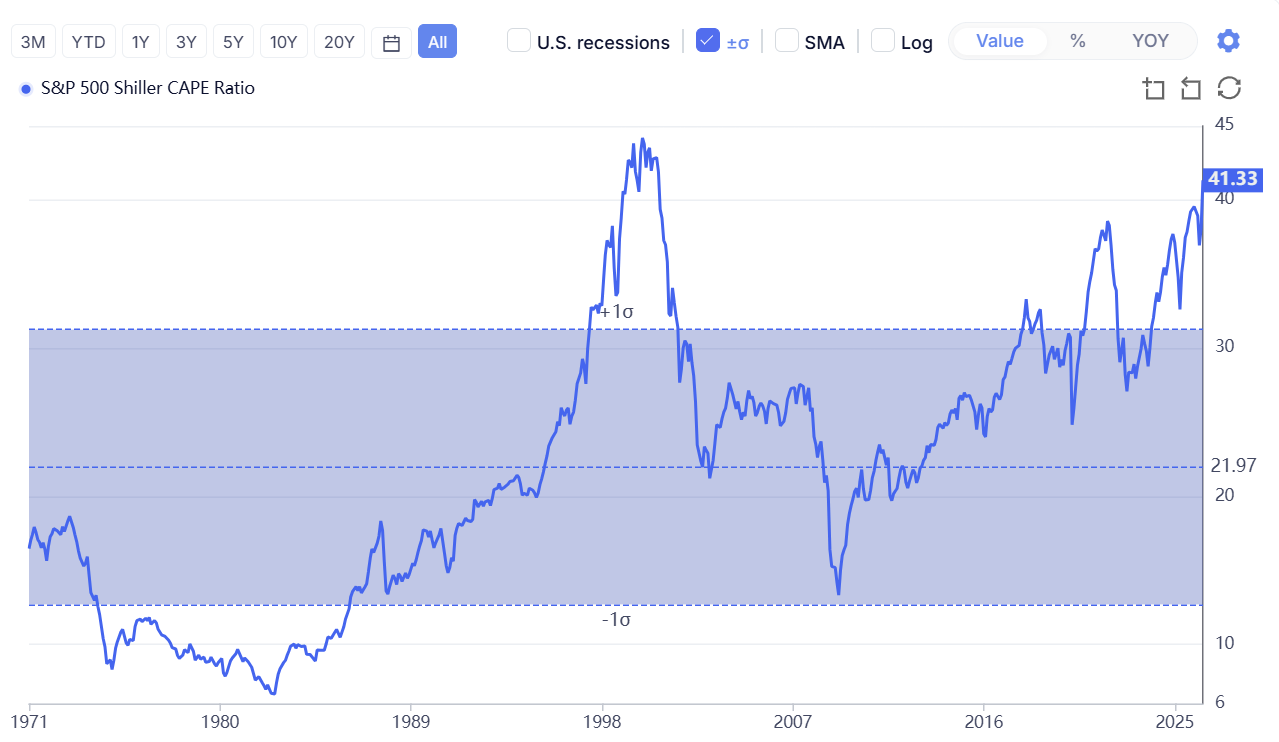
The S&P 500 Cyclically Adjusted Price-to-Earnings (CAPE) ratio, which divides the current price by the 10-year moving average of inflation-adjusted earnings, stands at approximately 39.58 to 41.6.This reading is more than twice its long-run historical average of 17.3. In over 140 years of U.S. market history, a higher CAPE ratio has been recorded only once: during the dot-com bubble peak in December 1999, when it reached 44.19 prior to a multi-year 50% drawdown.
The Buffett Indicator: The ratio of total stock market capitalization to gross domestic product (GDP) sits at a highly elevated range of 219.1% to 220%. This is the highest level ever recorded, significantly exceeding the historical "reasonable" range of 75% to 90% defined by Warren Buffett.
Berkshire Hathaway’s Cash Accumulation and Greg Abel's Mandate
The extreme valuation environment is reflected in the defensive positioning of the world's most prominent value investors. Under the leadership of new CEO Greg Abel, who succeeded Warren Buffett at the start of 2026, Berkshire Hathaway’s consolidated cash and short-term U.S. Treasury bill holdings swelled to a record $397.38 billion in the first quarter of 2026.
Berkshire has been a net seller of equities for 14 consecutive quarters, selling $24 billion worth of stocks while purchasing only $16 billion in the first quarter of 2026. This persistent liquidation represents net sales of over $200 billion over the past three years, indicating a structural lack of attractive asset acquisition opportunities. Greg Abel has conducted a significant "portfolio spring cleaning," completely exiting long-standing or tactical positions in UnitedHealth, Amazon, Domino's, Mastercard, and Visa, while concentrating Berkshire's remaining equity portfolio heavily in Apple and Alphabet.
The AI Capex Justification vs. Bubble Dynamics
Defenders of the current valuation regime argue that today's market is structurally distinct from the late-1990s dot-com bubble because the current rally is supported by massive, realized corporate earnings and cash flows. Bottom-up consensus estimates for S&P 500 EPS in 2026 and 2027 have been revised upward by 8% year-to-date.
However, a deeper analysis reveals that these upward revisions are highly concentrated. Increasing expectations for artificial intelligence capital expenditures (hyperscaler capex) and higher energy prices have driven the entirety of these positive revisions. Excluding AI infrastructure and Energy companies, S&P 500 2027 EPS estimates have been entirely flat year-to-date. Corporate profits as a share of GDP are at historic highs, but this profitability is concentrated in the dominant, highly concentrated technology platforms. This raises a significant risk of "extrapolation fallacy," where the market assumes that the massive capital spending boom in AI infrastructure can be sustained indefinitely without a corresponding rise in end-user application revenues.
Geopolitical Supply Shocks, Housing Constraints, and AI Disruption
A major component of the bearish market thesis relies on physical and financial catalysts: specifically, the inflationary supply shock from the Middle East and structural labor displacement.
Strait of Hormuz Closure and Global GDP Bottlenecks
Three months into the war in Iran, transits through the Strait of Hormuz remain severely depressed, with reported vessel counts down over 90% from normal levels. This strait is a vital global chokepoint, accounting for significant shares of global trade in crude oil, natural gas, refined petroleum products, petrochemical feedstocks (specifically naphtha), and fertilizers.
To evaluate the economic impact of an indefinite closure of the strait, Goldman Sachs economists utilize two contrasting modeling frameworks:
The Bottleneck (Leontief) Model: This model assumes a strict Leontief production function, where intermediate inputs are completely non-substitutable and output in each industry declines in direct proportion to the binding commodity supply restriction. Under this extreme assumption, a 100% loss of Middle Eastern non-oil goods would cause a catastrophic 27% reduction in global GDP, as localized shortages of critical chemical and industrial inputs cascade through global supply chains, halting downstream manufacturing.
The Allocation and Substitution (CES) Model: This model incorporates realistic macroeconomic margins of adjustment, allowing for the reallocation of scarce inputs from low-value to high-value-add industries, the elimination of non-critical inputs, and a modest constant elasticity of substitution (CES) between intermediate inputs.
When these adjustment mechanisms are calibrated, the projected direct growth headwind from a complete loss of Middle Eastern non-oil supply is dramatically reduced to 0.4% to 0.5% of global GDP.
According to the recent Goldman Sachs analysis, the economic adjustments are already occurring. Production cuts have been concentrated in low-value-added sectors like textiles and packaging, while high-value sectors like semiconductors have successfully secured critical inputs (such as helium) by bidding up prices. Consequently, while spot prices for crude oil, helium, and base chemicals surged immediately following the outbreak of hostilities, they have generally stabilized or retraced in recent weeks as demand destruction and inventory management rebalance markets. The direct core inflation pressure from chemical and refined product shortages is estimated at a manageable 0.4 percentage points, confirming that energy prices - rather than supply chain bottlenecks - remain the primary driver of the global inflation threat.
Housing Market Affordability and the Mortgage "Lock-In" Effect
The domestic housing market remains in a state of structural stagnation. Mortgage interest rates have consolidated at elevated levels, rendering home purchase highly unaffordable for a significant majority of prospective buyers. This affordability crisis is severely exacerbated by the mortgage "lock-in" effect. A vast portion of existing homeowners currently hold outstanding 30-year fixed-rate mortgages priced at 2% to 3%. Consequently, these homeowners are structurally disincentivized from listing their properties for sale, as purchasing a comparable replacement home at current prevailing rates would result in a doubling of their monthly debt service payments. This dynamics has caused a severe contraction in existing home sales, keeping housing prices artificially elevated despite weak transaction volume, while residential fixed investment continues to act as a drag on economic activity.
AI Integration and Structural Labor Market Displacement
While aggregate payroll growth has stabilized in the near term, with employment increasing by 115k in April and the unemployment rate at 4.3%, structural labor market anxieties are rising.
The integration of artificial intelligence is beginning to shift corporate labor demands. While Dallas Fed surveys indicate that AI has had limited immediate impact on aggregate employment, nearly half of surveyed firms expect the technology to either change the type of workers required or directly reduce their net headcount over the next few years. Specifically, 20% of firms currently utilizing AI expect the technology to reduce their need for workers in the medium term, particularly in high-exposure white-collar categories such as software development, contract review, human resources, customer service, and transaction processing. This structural transition, occurring alongside flat to negative real income growth, intensifies the financial fragility of the middle-income household cohort.
Capital Flows and Private-to-Public Market Transitions
A critical focus of institutional market participants is the imminent public listing of several of the largest private technology firms in history, most notably SpaceX, OpenAI, and Anthropic. The market-mechanic implications of these multi-hundred-billion-dollar liquidity events are substantial.
The primary structural risk associated with these mega-IPOs resides in the transition of capital flows and the mechanics of insider lockup expirations. Bearish market narratives suggest that the expiration of insider selling restrictions toward the end of the year will unleash a massive "selling cascade," draining aggregate liquidity from the secondary equity market and accelerating a systemic market crash.
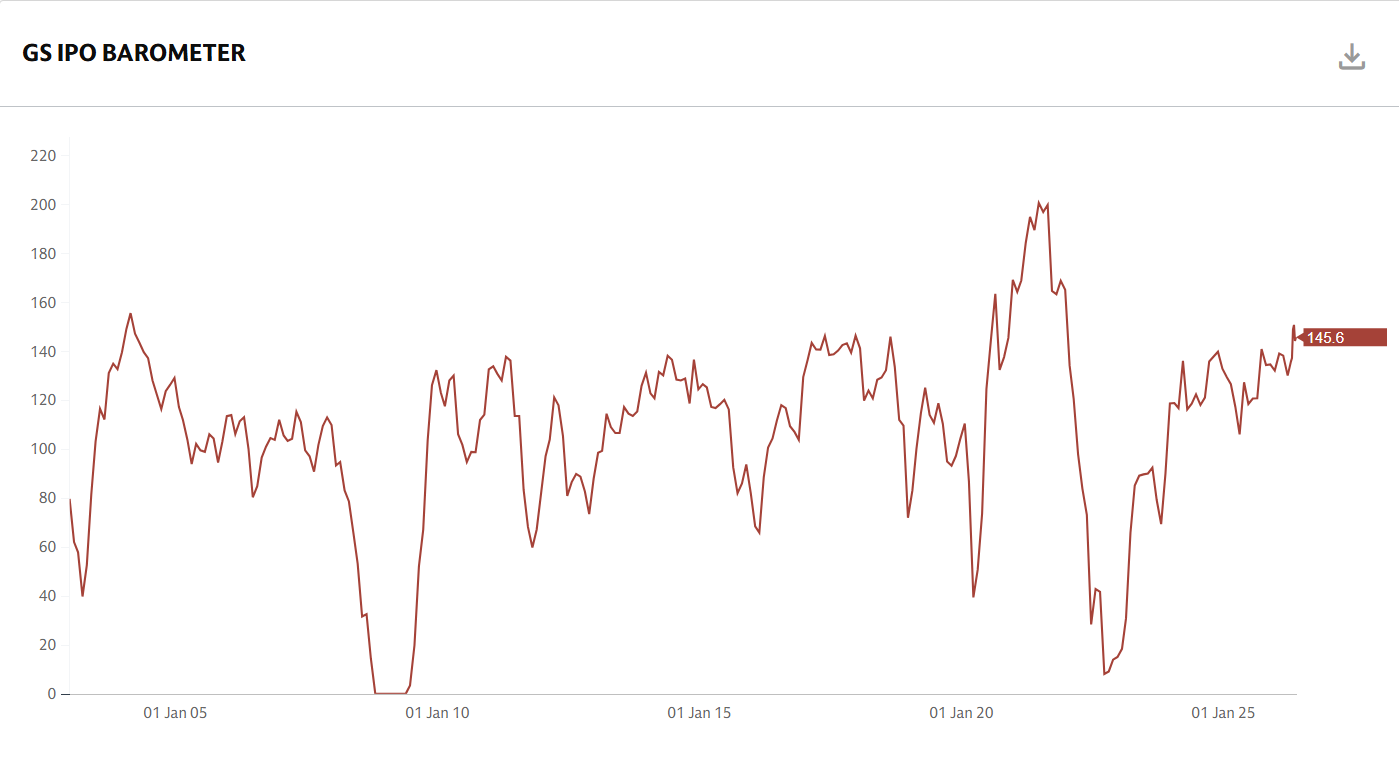
Goldman Sachs IPO Barometer
An objective evaluation of market structure suggests a more nuanced outcome. The Goldman Sachs IPO Barometer currently stands at 151, well above its historical median of 100, indicating that macroeconomic conditions remain highly conducive to primary underwriting and public equity issuance. This elevated reading is supported by the record-high share of corporate profits to GDP, which provides corporate and institutional balance sheets with ample liquid reserves to absorb new equity issuance.
However, the timing of these massive equity supply events presents a clear tactical risk. Because public equity positioning is currently highly crowded and leveraged, with hedge fund gross leverage and net exposure to the Momentum factor sitting near 5-year highs, the introduction of hundreds of billions of dollars in new, highly valued technology equity could trigger a significant "crowding-out" effect. Institutional capital may rotate out of existing secondary market positions to fund allocations in these newly listed AI and aerospace leaders. Rather than triggering a systemic market collapse, this transition is highly likely to catalyze a sharp Momentum reversal, as long-term investors rotate out of extended, high-flying software and hardware stocks to capture exposure in the new listings, leading to a rapid compression of market multiples.
Critical Evaluation of a 35% to 45% Market Drawdown
To synthesize this comprehensive structural analysis, it is necessary to systematically weigh the empirical evidence for and against the extreme bearish thesis of an imminent 35% to 45% equity market drawdown.
Structural Factors Opposing a Systemic Crash
The structural conditions that characterized previous catastrophic systemic collapses (such as 1929, 1987, and 2008) are largely absent in the current regime:
Massive Corporate Cash Flows: In contrast to the 1999–2000 dot-com peak, where highly valued technology companies lacked viable business models or earnings, the dominant technology firms driving the current index returns operate with unprecedented profit margins and robust, realized cash flow generation.
Highly Capitalized Financial System: The banking sector and broader financial system exhibit high capital ratios, and systemic mortgage delinquency rates remain exceptionally low.1 This stands in stark contrast to the subprime debt structures and high leverage that precipitated the 2008 Great Financial Crisis.
Macroeconomic Substitution Elasticity: Empirical data on industrial production and firm adaptation demonstrates that global supply chains possess deep margins of adjustment. The economic impact of the Strait of Hormuz closure is manageable, preventing a cascading global industrial halt.
Factors Supporting a Significant Tactical Correction (15% to 25%)
Conversely, a substantial equity market correction and multi-asset repricing are highly justified by the prevailing macroeconomic frictions:
Valuation Overhang: A Shiller CAPE ratio above 39x and a Buffett Indicator at 220% represent historical valuation extremes that have always preceded poor, often negative, 10-year real forward returns.
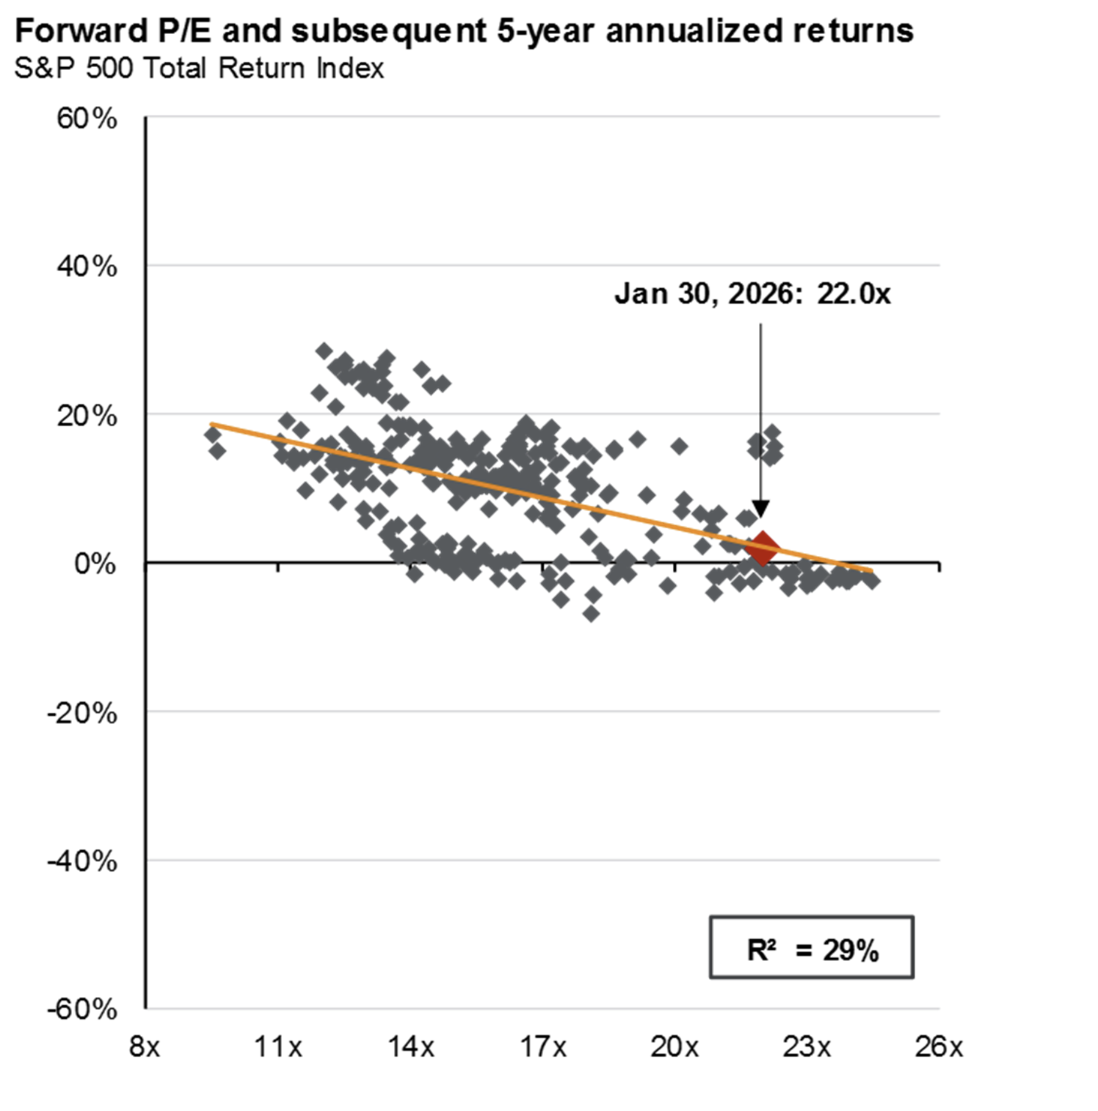
J.P. Morgan P/E Ration & Forward Equity Market Returns:
One of the most compelling charts of the year is that of J.P. Morgan’s forward P/E ratio and subsequent 5-year annualized equity market returns study. It is sobering, in that this chart represents the historical relationship between forward P/E levels and subsequent 5-year returns. In every case, without exception, forward returns were between 0% and 3%. And this data was published approximately 5 months ago, before the meteoric rise in the S&P that has occurred in the subsequent months since.
The Boxed-In Central Bank: With CPI and PPI inflation printing significantly above expectations (+3.8% CPI), and term yields consolidated at elevated levels, the Federal Reserve is structurally prohibited from implementing rate cuts to support a slowing real economy. This prevents the "Fed Put" from acting as an immediate backstop during a market correction.
Consumer Fatigue: The depletion of household savings and the emergence of severe "survival debt" defaults among low-to-middle income cohorts will act as a structural drag on aggregate consumer demand in the second half of 2026.
In the end, we are of the view that downside risk is now far more dominant a theme to contemplate and posture for, than upside continuation.
Portfolio Strategy and Capital Allocation Recommendations
We are equally mindful of the maxim widely attributed to John Maynard Keynes: markets can remain irrational longer than investors can remain solvent. It remains entirely plausible that AI-driven momentum, concentrated in an exceptionally small number of S&P 500 constituents, continues to support headline index performance for some period of time — whether for another quarter, another year, or even longer. From a tactical trading perspective, being directionally correct but temporally premature is often indistinguishable from being wrong. The opportunity cost of exiting a rising market too early can be substantial, and the behavioral discipline required to remain on the sidelines while a narrow market melts higher is extraordinarily difficult. More often, investors who de-risk too early eventually capitulate back into the market near the most fragile point of the cycle, precisely when valuation, positioning, and sentiment are most extended. Very few investors possess both the analytical discipline and psychological fortitude to sustain a highly defensive posture through the final stages of a speculative advance. Accordingly, the analysis presented in this report should be understood primarily through a strategic, long-term capital allocation lens, rather than as a short-term trading call. Were the objective purely tactical, one could reasonably construct trading strategies designed to participate in the continuation of current AI-led momentum. That, however, is distinct from the governance responsibility of institutional capital: to evaluate asymmetry, preserve optionality, and avoid allowing short-term performance pressure to obscure long-term fragility.
For institutional capital to navigate this highly bifurcated structural environment, our view is that capital allocation should limit and or significantly reduce aggregate index tracking and transition toward a highly defensive, relative-value framework.
Transition to the "Insensitive Portfolio"
Given that the direction of the S&P 500 is currently determined by the "One Big Trade" of AI momentum, investors seeking to insulate capital from a systemic valuation compression should reallocate out of broad market indices and build exposure in the "Insensitive Portfolio". This strategy targets equities within the Russell 1000 that exhibit positive consensus earnings revisions but possess the lowest share price sensitivity to both the AI trade and the market's pricing of aggregate macroeconomic growth.
At a sector level, Consumer Staples screens as the group with the lowest structural sensitivity to both AI momentum and geopolitical shocks. Strategic allocations should target high-quality staples and medical technology providers with resilient cash flows and robust pricing power.
Pair Long Equity with Volatility Overlays
Rather than completely liquidating equity exposure - which incurs significant opportunity cost if technology earnings continue to beat near-term projections - investors should utilize structured options strategies. Because single-stock implied volatility has risen while aggregate index-level implied volatility and correlations remain exceptionally low, index-level put options are highly underpriced relative to their underlying tail risks.
Institutional portfolios should maintain constructive long allocations in high-quality, cash-generating enterprises while pairing those positions with long, longer-dated S&P 500 put options to limit systemic downside exposure. Out-of-the-money downside hedges in European equities and global credit spreads represent highly efficient, cross-asset protection against a potential re-escalation of Middle Eastern hostilities.
Strategic EM Carry Allocation
Faced with a range-bound dollar and a halted developed-market easing cycle, institutional fixed-income portfolios should allocate to emerging market currency carry strategies. Emerging market central banks are projected to maintain higher real rates to defend their currencies and manage local inflation, creating a highly attractive carry profile.
Capital should be deployed long in high-carry emerging market currencies that operate as net energy producers—specifically the Brazilian Real (BRL), Mexican Peso (MXN), and South African Rand (ZAR)—funded by structurally weak, low-yielding developed market currencies, such as the Euro (EUR) and Swedish Krona (SEK), which exhibit high vulnerability to Middle Eastern energy shocks.
Maintain Capital Reserves Consistent with Berkshire Hathaway
Finally, institutional allocators should have investment committee debate around the merits of replicating the highly defensive, liquid posture exhibited by Berkshire Hathaway. Holding elevated cash and short-term sovereign debt balances - which currently generate attractive yields above 4% - provides vital capital preservation and structural optionality. Maintaining significant liquidity ensures that when a tactical multiple compression or a momentum-driven correction occurs, the portfolio possesses the immediate capacity to acquire high-quality, cash-generating assets at deeply discounted valuations. We cannot stress this enough.
We would be honored to serve as a resource for your organization. Contact us today to discuss:
Contact | Connect with Financial Experts — Wind River Capital Strategies