The Architecture of Fragility
A Structural Analysis of Market Extremes, Capital Circularity, and the Power of Mean Reversion
“Better is the end of a thing than the beginning thereof; and the patient in spirit is better than the proud in spirit”
King Solomon, Ecclesiastes (Kohelet) 7:8
Introduction: The Suspension of Disbelief
We stand at a moment in financial history characterized by a profound and disquieting dissonance. On the surface, the aggregate metrics of the market suggest a robust, almost invincible economic engine, propelled by the twin thrusters of a technological revolution in Artificial Intelligence (AI) and a resilient consumer. Yet, beneath this veneer of prosperity lies a fracturing foundation. As stewards of capital committed to the preservation of wealth over the intoxication of momentum, we find ourselves navigating an environment that demands not merely caution, but a rigorous forensic deconstruction of the narratives currently supporting asset prices.
The prevailing market consensus has embraced a "Goldilocks" scenario: falling inflation, sturdy growth, and a seamless transition to an AI-driven productivity miracle. However, our analysis of the underlying data suggests we are witnessing a classic cycle of euphoria, characterized by the suspension of disbelief and the decoupling of price from value. We observe a market structure held aloft by circular financing mechanisms in the technology sector, historic valuation extremes in public equities, and a consumer economy that is tearing itself apart along socioeconomic lines.
This report is not a forecast of doom for its own sake, but a recognition of the asymmetric risks accumulating in the system. We align ourselves with the philosophy of historical realists, akin to the rigorous skepticism of Howard Marks or the value-orientation of Warren Buffett, who recognize that trees do not grow to the sky, and that trees with poor roots eventually fall. Continuing the theme of our prior report “The Narrowing Path”, the focus of this year-end report and 2026 outlook is to identify the "cracks under the surface," specifically the perilous state of small-cap balance sheets, the illusory nature of certain AI revenue streams, and the structural necessity of allocating to tangible assets like gold and silver as hedges against stimulus related debasement of fiat currency.
The Anatomy of Euphoria: Valuation Extremes and the "Ten-Times" Anomaly
To understand the magnitude of the current risk, one must first confront the sheer scale of valuation distortion. In a rational capital market, paying ten times a company’s gross revenue, before a single dollar of expense, tax, or debt service is paid, implies an expectation of flawless execution, monopolistic dominance, and exponential growth that persists for decades. Historically, such valuations were reserved for a tiny fraction of hyper-growth anomalies. Today, they have become the standard.
The Metastasization of Speculation
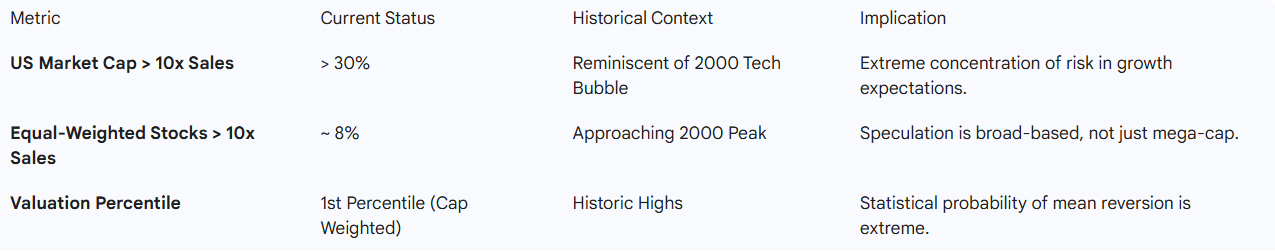
An analysis from the GMO Asset Allocation team reveals a statistic that should give any prudent allocator pause: more than 30% of the entire U.S. market capitalization now trades above this 10x sales threshold. To contextualize this, one must look back to the peak of the Technology Bubble in 2000. We are currently revisiting those rarefied heights, a level of concentration in expensive assets that has historically served as a reliable precursor to a "lost decade" of returns.
The narrative driving this distortion is distinctively narrow. Five of the "Magnificent 7" companies currently exceed this 10x sales threshold, effectively skewing the aggregate market metrics and masking the mediocrity of the broader index. However, it would be an error to dismiss this as merely a "mega-cap" phenomenon. The speculative contagion has spread downward. On an equal-weighted basis, roughly 8% of all U.S. stocks trade above 10x sales. This figure is approaching the 2000 peak and is uncomfortably close to the speculative froth seen during the 2020 growth bubble.
This data suggests that speculation has spread beyond the high-quality market leaders. It has inflated valuations for a broad swathe of firms that lack the fortress balance sheets, monopolistic moats, or pricing power of the top-tier technology giants. When nearly one-tenth of the investable universe relies on perfection to justify its price, the system becomes exquisitely fragile. History is unambiguous on this point: such extremes in Price-to-Sales dispersion rarely persist without painful corrections. We are essentially pricing in a future where competition, regulation, and cyclicality have ceased to exist.
The Fragility of "Sky-High" Expectations
The justification for these multiples is almost entirely predicated on the transformative potential of Artificial Intelligence. Proponents argue that the dominant business models and exceptional growth trajectories of the market leaders render traditional valuation metrics obsolete. However, we maintain a stance of profound skepticism toward "this time is different" narratives. Even great companies can and do disappoint when expectations are set at the stratosphere.
The GMO analysis rightly points out that speculation has inflated valuations for many firms without the market power or fundamentals of the top-tier leaders. The market reflects risk, not optimism. When an asset is priced for perfection, any deviation from the ideal outcome, be it a regulatory headwind, a slight deceleration in growth, or a shift in the cost of capital, can trigger a nonlinear re-pricing event. This is the hallmark of late-stage cycle behavior, where the fear of missing out (FOMO) supersedes the fear of loss.
The Ouroboros Economy: Circular Financing in the AI Capex Cycle
If valuation is the symptom, the "AI Capex Funding Cycle" is the mechanism of the potential pathology. We are observing a capital structure in the technology sector that bears haunting resemblances to the telecom fiber boom of the late 1990s and the vendor-financing schemes that precipitated the collapse of Enron. The prevailing narrative is one of insatiable demand for AI infrastructure, yet a forensic examination of the cash flows suggests a degree of circularity that threatens the integrity of the entire ecosystem.
The Mechanics of Round-Tripping and "Cloud Credits"
The current boom is fueled by a dynamic where cloud providers (hyperscalers) and chipmakers invest heavily in AI startups, which in turn use that capital to purchase cloud services and hardware from their benefactors. This phenomenon, often termed "round-tripping" or "circular financing," creates the optical illusion of revenue growth while masking the lack of genuine end-user demand.
Consider the mechanism: A hyperscaler invests $1 billion into an AI foundation model startup. That startup, often legally bound or strategically incentivized via "cloud credits," utilizes that cash to purchase compute capacity from the hyperscaler. The money leaves the hyperscaler’s balance sheet as an "investment" and returns to its income statement as "revenue". This boosts the hyperscaler’s top-line growth, justifying its high stock multiple, which allows it to raise cheaper capital to make more investments.
Critically, this revenue is low-quality. It is not derived from end-user consumption or organic economic demand but from the recycling of investor capital. Analysts have noted that startups tracked by Kruze Consulting now spend roughly half their revenue on cloud and model inference, a figure that has doubled in two years. When a startup solves a $100 problem but incurs $120 in compute costs subsidized by venture capital, it does not have a business model; it has a subsidy program. This echoes the dot-com era, where telecom companies swapped capacity to inflate revenues without generating cash.
Howard Marks on Bubbles: Inflection vs. Mean Reversion
Oaktree’s Howard Marks provides a critical framework for analyzing this phenomenon, distinguishing between "Inflection Bubbles" and "Mean-Reversion Bubbles".
Inflection Bubbles: These are predicated on genuine technological progress (e.g., railroads, the internet). They eventually crash, destroying investor wealth, but they leave behind vital infrastructure that advances society.
Mean-Reversion Bubbles: These are financial fads (e.g., sub-prime mortgages) that offer no societal advancement and simply redistribute wealth before collapsing.
While AI is undoubtedly an "Inflection Bubble" driven by transformative technology, this does not inoculate investors from ruin. The railroad boom of the 19th century and the fiber boom of the 1990s both laid the groundwork for future prosperity, yet the investors who financed them were largely wiped out. The "installation phase" of technology is notoriously capital-destructive.
We are currently seeing deals where OpenAI and others have made investment commitments totaling trillions, despite lacking current profitability.1 Goldman Sachs estimates that a significant portion of Nvidia’s sales next year may come from these circular deals. This raises the uncomfortable question: Has the AI industry developed a perpetual motion machine of capital destruction, disguised as growth?
The Return on Invested Capital (ROIC) Gap
The "US data center and power demand boom" is real and tangible, tightening power markets and risking higher prices and outages. However, the spending is outpacing monetization to a degree that recalls the dot-com era's worst excesses. While today’s tech giants have tangible products, unlike the "vaporware" of 1999, the valuation premiums attached to them assume a seamless transition from infrastructure build-out to profitable application layers.
If the application layer (the "killer app" beyond chatbots) fails to materialize quickly, the depreciation schedules of these massive GPU clusters will wreak havoc on earnings. We are already seeing signs of this stress; 2026 earnings estimates for the "Magnificent 7" have been revised upward aggressively, while the rest of the market (the S&P 493) sees downward revisions. This divergence creates a single point of failure for the market: if the circular flow of AI funding slows, the growth narrative collapses.
The Monetary Revolt: Gold, Silver, and the Debasement Hedge
Against this backdrop of equity exuberance and circular financing, a quieter but structurally significant shift is occurring in the monetary metals, as outlined in part in our “Golden Age” report. We view the allocation to precious metals not merely as a trade, but as a necessary inoculation against the twin risks of fiat debasement and geopolitical fragmentation. The performance of these metals over the last 2-3 years suggests a decoupling from real rates and a re-coupling with sovereign risk.
The Structural Case for Gold: The $4,900 Target
Our research aligns with the bullish outlooks projecting gold to reach $4,900 per ounce by December 2026, a potential upside of roughly 14% from baseline levels. This conviction is not driven by retail speculation, but by the heavy hand of the official sector.
The primary driver is the US-China geopolitical power race. Emerging Market (EM) central banks, particularly the People's Bank of China (PBOC), are aggressively diversifying reserves away from US Treasuries and into gold. This is a defensive maneuver to hedge against "sanctions risk" and the weaponization of the dollar observed during the Russia-Ukraine conflict. The freezing of Russian central bank assets in 2022 was a watershed moment, fundamentally altering the risk calculus for sovereign reserve managers.
Currently, China and other EM central banks remain significantly underweight gold relative to their total reserves. While the US holds approximately 70-80% of its reserves in gold, China’s holdings are estimated at a fraction of that (under 5%), with a plausible target of 15-20% suggesting a multi-year bid under the market. This creates a high floor for gold prices. Furthermore, the "potential broadening of diversification to private investors" in the West, who are currently under-allocated (gold ETFs represent just 0.17% of US private financial portfolios), provides a massive asymmetric upside risk.
The Silver Squeeze: Industrial Necessity meets Structural Deficit
While gold is the geopolitical hedge, silver represents the intersection of monetary heritage and industrial necessity. The metal is currently entering its fifth consecutive year of structural supply deficit, a fundamental imbalance that is rewriting the economics of the industry.
Supply Inelasticity: Global mine supply is stagnant at approximately 813 million ounces. Because 80% of silver is mined as a by-product of lead, zinc, and copper, supply is price-inelastic; higher silver prices do not immediately trigger new production because miners target the base metals, not the silver. This means the supply response mechanism is broken.
Demand Explosion: Industrial demand is being driven by the "three pillars" of the energy transition: Photovoltaics (PV), Electric Vehicles (EVs), and AI data centers.
Solar: Solar panel manufacturing alone consumes hundreds of millions of ounces. Despite "thrifting" (using less silver per unit), the sheer volume of installations—projected to grow at 15-17% CAGR through 2026—is overwhelming supply.
EVs & AI: Electric vehicles require significantly more silver than internal combustion engines for contacts and circuitry. Furthermore, the massive expansion of AI infrastructure requires silver for high-performance connectors and switches.
Performance Outlook: Silver has outperformed gold significantly in 2025, with gains exceeding 120% in some metrics, driven by this physical scarcity. Forecasts suggest a sustained move above $70 per ounce in 2026 as above-ground stockpiles in London and COMEX vaults are depleted to critical levels. We view silver as a leveraged play on the "electrification of everything." Unlike gold, which is hoarded, silver is consumed. The "AI Tax" on power grids requires massive upgrades in transmission, of which silver is a key component. We are positioning for a scenario where the gold-silver ratio compresses significantly as the industrial shortage becomes acute.
The Insurance Value of Commodities
Beyond price appreciation, we emphasize the "insurance value" of commodities. As US-China competition intensifies, supply chains for critical minerals are becoming geopolitical chokepoints. China controls 92% of rare earth refining, 59% of lithium, and 44% of copper refining.1 In a world of fragmenting trade, holding physical commodities is a hedge against the loss of access. We advocate for a Long Copper / Short Aluminum trade structure: Copper faces geological mine supply constraints, while Aluminum supply is surging due to China’s strategic overcapacity push.
The Bifurcated Reality: The K-Shaped Economy and Consumer Erosion
While the headlines celebrate GDP growth and low unemployment, a forensic analysis of corporate earnings calls and alternative data reveals a deeply fractured US economy. We are witnessing a K-shaped dynamic where the divergence between the "haves" (asset owners, high-income earners) and the "have-nots" (wage earners, renters) has become a chasm. This is not a unified economy; it is two separate realities drifting apart.
Quantitative Sentiment: The Tale of Two Consumers
Goldman Sachs’ quantitative sentiment analysis of Q3 2025 earnings calls illustrates this bifurcation with precision.
The High End: For retailers exposed to middle-to-higher income zip codes, sentiment remains robust (diffusion index of 67), and nominal same-store sales grew by 2.5%. The "wealth effect" from the equity and housing boom is keeping this cohort spending.
The Low End: Conversely, for retailers serving lower-income zip codes, sentiment has turned net negative (diffusion index of 45). Nominal same-store sales for this group are effectively stagnant, growing at just 0.2%—a severe contraction in real terms.
The Mechanics of Erosion
This underperformance is not a temporary blip; it is structural. The low-end consumer is being crushed by a confluence of factors:
Exhaustion of Excess Savings: The pandemic-era buffers are gone, replaced by rising credit card balances.
Credit Constriction: Limited borrowing capacity as delinquencies rise in subprime auto and credit cards.
Income Stagnation: Real income growth for the bottom quintile is forecast to underperform significantly in 2026, exacerbated by cuts to SNAP and Medicaid benefits stemming from the OBBBA.
Immigration Slowdown: A reduction in labor supply growth is impacting the demographics that traditionally drive low-end consumption volume.
This erosion introduces a fragile tail risk to the broader market. The US economy is 70% consumption. If the weakness at the bottom migrates upward, the "trickle-up poverty" effect, the aggregate revenue estimates for S&P 500 consumer discretionary companies will prove overly optimistic. We are already seeing companies mention "trade-down" behaviors, a classic precursor to recessionary retrenchment.
The Zombie Apocalypse: Russell 2000 and the Refinancing Wall
While the S&P 500 is buoyed by the cash-rich fortress balance sheets of the Magnificent 7, the Russell 2000 (small-cap) index represents the "real" economy, and it is flashing red warning signals. The divergence between large-cap stability and small-cap fragility is arguably the most significant mispricing in the current market.
The Profitability Crisis
Approximately 40-46% of Russell 2000 constituents are unprofitable. This is a staggering figure, roughly double the level seen during the 2008 Financial Crisis. These "zombie companies" rely on cheap debt to service existing liabilities. In a zero-interest-rate policy (ZIRP) world, they could survive on refinancing. In a "higher-for-longer" environment, or even a "higher-than-2021" environment, they are mathematically insolvent.
The 2026 Refinancing Wall
A massive wave of corporate debt is set to mature in 2026 and 2027, totaling over $700 billion for small-cap borrowers. These companies locked in fixed rates of 0.5% - 2% during the pandemic. They are now facing refinancing at rates of 5% - 8% or higher.
This creates a binary outcome for the small-cap universe:
The Fortress Balance Sheets: Companies with low leverage and niche dominance will survive and potentially consolidate market share.
The Zombies: Companies unable to cover interest expenses will face a wave of bankruptcies, distressed exchanges, or fire sales.
Private credit funds, which stepped in to fill the void left by regional banks, are already heavily committed and may lack the capacity to rescue every troubled borrower. We expect credit spreads to widen significantly in 2026 as the market begins to price in this default cycle. Investors holding passive small-cap indices (IWM) are unwittingly holding a bag of potential insolvencies. Active selection in this sector is not just preferred; it is a survival requirement.
Floating Rate Vulnerability
Unlike the S&P 500, which locked in long-term fixed debt, the small-cap and leveraged loan markets are heavily exposed to floating-rate debt. While Federal Reserve cuts (anticipated at 50bps in 2026) will offer some relief, they may be "too little, too late" for companies with interest coverage ratios already below 1.0x. The benefit of lower rates will be offset by the widening of credit spreads as default risks materialize.
Venture Capital and the Liquidity Drought: The "Have-Nots"
The private markets are mirroring the bifurcation seen in the public sphere. We are witnessing a brutal "Haves vs. Have-Nots" dynamic in fundraising, creating a liquidity drought that threatens the innovation ecosystem.
The Fundraising Winter
Venture Capital fundraising has collapsed, raising only $140.4 billion over the trailing four quarters - a 42.5% year-over-year decline. Fund counts have dropped by 45%. This is not a cyclical dip; it is a structural reset. LPs (Limited Partners) are over-allocated to private markets (the "denominator effect") and are receiving very little cash back from exits (IPOs and M&A), trapping them in illiquidity.
This has created a "dry powder" aging problem. Capital committed years ago is expiring or being deployed cautiously. The median time to close a fund has extended significantly, and emerging managers are being wiped out. Capital is consolidating into a few mega-funds and elite managers ("The Haves"), while the vast majority of the VC ecosystem ("The Have-Nots") is starving.
Implications for Innovation and AI Circularity
This capital drought creates a dangerous feedback loop with the AI circularity thesis discussed earlier. If VC money dries up, the "subsidy" for AI consumption dries up. If startups cannot raise fresh capital to pay their cloud bills, the revenue growth of the hyperscalers stalls. The entire ecosystem is leveraged on the assumption of continuous, abundant venture funding. That assumption is now false. The "haves" in the VC world are those participating in the circular AI economy, while the "have-nots" are the traditional software and consumer startups that are being starved of capital.
Sector-Specific Deep Dives
The Energy Transition Paradox: Surplus Today, Shortage Tomorrow
The energy markets present a complex duality for 2026. On the micro level, we are facing supply waves. A short-lived oil supply surge in 2025-2026 is expected to push markets into surplus, potentially depressing Brent and WTI crude prices to averages of $56 and $52 respectively. Simultaneously, a massive LNG supply wave (2025-2032) is projected to create a global gas glut, slashing European TTF prices by nearly 35% by mid-2027.
However, this bearish price action masks a structural bullishness for the infrastructure required to move and consume this energy. The "US power market tightening" is a critical theme. The explosive demand from AI data centers is colliding with a grid that hasn't seen load growth in decades. This creates a risk of "much higher prices, outages, and bottlenecks".
Investment Implication: We avoid direct long exposure to oil/gas commodities in the short term (2026) due to the supply overhang. Instead, we focus on the infrastructure bottlenecks: copper (grid buildout), power producers with dispatchable capacity, and the silver required for the solar rollout that attempts to plug the energy gap. The "Long Copper / Short Aluminum" trade is the purest expression of this view: Copper is supply-constrained and demand-positive (electrification), while Aluminum is supply-abundant due to Chinese strategic sovereignty policies.
The Healthcare Defensive Line
Amidst the volatility of tech and the erosion of the consumer, Healthcare emerges as a "First-Line Option" for defensive growth. After languishing for years, the sector is closing its underperformance gap. Our analysis favors Biopharma as an "AI-trade hedge".
Valuation Support: Biopharma valuations are historically low relative to expected profitability (ROE) and the broader S&P 500.
Innovation Cycle: Unlike the ephemeral nature of some software revenue, the innovation in healthcare is tangible. We are entering a "Cardiology Renaissance" and seeing the "Oncology Unlock" through ADCs (Antibody-Drug Conjugates) and bispecifics.
Specific Opportunities: We look to large-cap pharma with upward revision potential and select SMID caps with de-risking catalysts. The sector offers immunity to the K-shaped consumer recession, as healthcare utilization is largely non-discretionary and supported by secular demographic tailwinds (aging population).
The Private Equity Reckoning
The "Golden Age" of easy exits is over. Private equity funds are sitting on a record amount of aged NAV (Net Asset Value) that they cannot sell without realizing losses. The "bid-ask" spread between buyers and sellers remains wide.
For 2026, we see a continued bifurcation. The "Haves" - funds with fresh vintages and dry powder - can buy distressed assets at attractive valuations. The "Have-Nots" - funds holding assets purchased at 2021 multiples - will be forced into "NAV loans" and other financial engineering tactics to return capital to LPs, further leveraging their portfolios. We advise extreme caution in General Partner (GP) selection, favoring those with proven operational value-add capabilities over financial engineers.
Conclusion: The Power of Mean Reversion
As we look toward 2026, we find ourselves standing on the precipice of a mean reversion. The market is pricing in a "Goldilocks" scenario: falling inflation, resilient growth, an AI productivity miracle, and a soft landing. Our analysis suggests this pricing is deeply flawed and fundamentally fragile.
We see a market held aloft by circular financing structures in AI that mimic the worst excesses of the dot-com era. We see concentrated valuation extremes in equities where 30% of the market trades at sales multiples that historically guarantee poor returns. We see a consumer base that is financially exhausted, hiding behind an aggregate number that is distorted by the wealthy. And we see a zombie army of small-cap companies marching toward a refinancing wall that private credit may not be able to fully absorb.
Strategic Positioning
In light of this, our stance is defensive, tangible, and contrarian:
Underweight US Mega-Cap Tech: The risk/reward at >10x sales is asymmetric to the downside. We view the AI capex cycle as a bubble likely to deflate as ROI questions mount and circularity is exposed.
Long Real Assets (Gold & Silver): We advocate a meaningful allocation to monetary metals. Gold ($4,900 target) hedges the monetary debasement and geopolitical fracture. Silver offers leverage to the industrial reality of energy shortages and solar demand.
Avoid Passive Small Cap Indices: The Russell 2000 contains too much terminal risk via its high concentration of unprofitable companies. Focus on active selection of small-cap "fortress" balance sheets that can survive the 2026 maturity wall.
Long Energy Volatility & Infrastructure: With an oil surplus predicted for 2026 but long-term structural underinvestment, we expect volatility. The trade is not the commodity itself, but the grid that must carry the electrons (Copper) and the panels that must generate them (Silver).
Cash is Optionality: In a world of elevated yields, cash is not trash; it is a call option on asset deflation. It provides the dry powder necessary to act when the mean reversion inevitably occurs.
We are not merely skeptics; we are students of history. And history teaches that when the cost of capital rises, circular financing breaks, valuation extremes revert, and the "new era" often looks a lot like the old era, just with different winners. We position not for the perfection priced in today, but for the reality that will arrive tomorrow.
We would be honored to serve as a resource for your organization. Contact us today to discuss:
Contact | Connect with Financial Experts — Wind River Capital Strategies
Sources:
Goldman Sachs, Global Economics Analyst: Macro Outlook 2026 Sturdy Growth, Stagnant Jobs, Stable Prices, Goldman Sachs, Global Equity Strategy: 2026 Outlook Tech Tonic — a broadening bull market, Goldman Sachs, US Equity Views: Economic acceleration and AI adoption should support solid S&P 500 EPS growth in 2026 and 2027, Goldman Sachs, Commodity Views: 2026 Outlook Ride the Power Race and Supply Waves, Goldman Sachs, US Economics Analyst: Low-End Consumer Underperformance; Growing AI Focus in Labor Market Discussions, Goldman Sachs, US Weekly Kickstart: Holiday deals for investors in middle income consumer stocks, Goldman Sachs, US Daily: What Can the Producer Price Index Tell Us About Inflation?, Goldman Sachs Asset Management, Investment Outlook 2026 Seeking Catalysts Amid Complexity, Goldman Sachs, Global Strategy Paper: Building Long-Term Returns Our 10-Year Forecasts, Goldman Sachs, US Economics Analyst: From IT to AI What Explains US Productivity Outperformance?, Goldman Sachs, USA: Payroll Growth Slightly Above Expectations in November; Unemployment Rate Increases on Government Effects, J.P. Morgan Asset Management, 2026 Year-Ahead Investment Outlook, J.P. Morgan Asset Management, Guide to the Markets US, PitchBook, Q3 2025 Global Private Market Fundraising Report, Precious Metals Research (as included), Precious Comment Central Bank Buying Remained Resilient in Highly Volatile October, Oaktree Capital Management, Howard Marks Is It a Bubble, Silvercrest, Economic & Market Outlook 2026 & Beyond, J.P. Morgan, Forward P/E and Subsequent 5yr Returns.